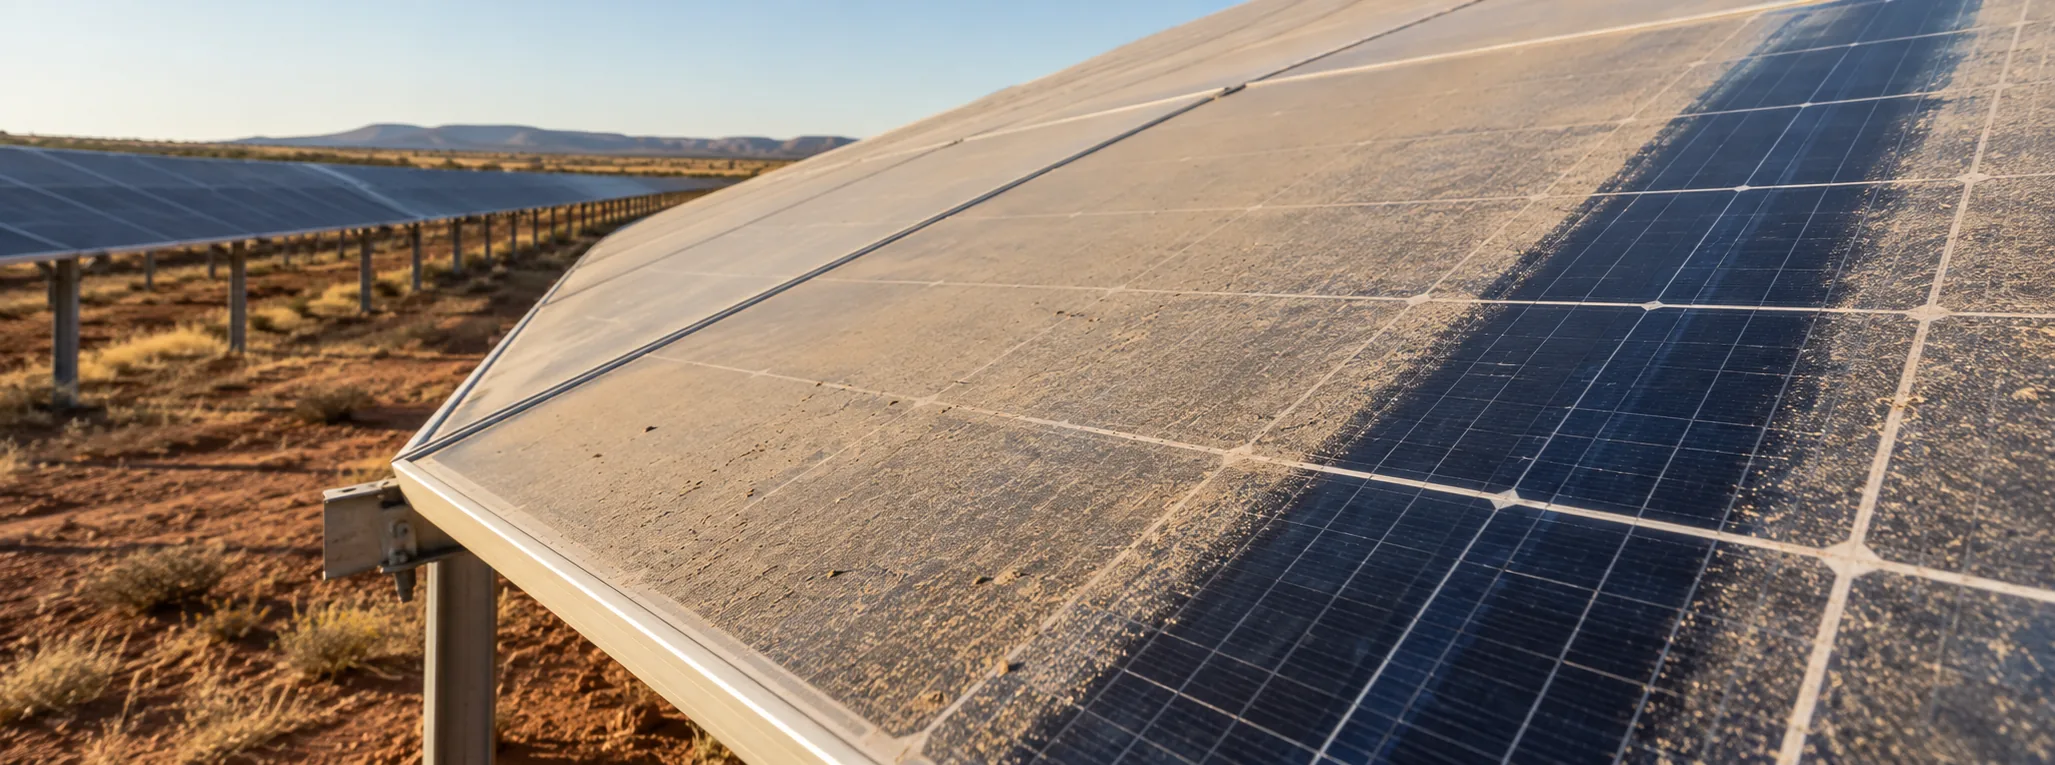
For a solar farm owner or operator, soiling creates an awkward decision. Cleaning too often wastes labour, water and equipment time. Waiting too long allows avoidable generation loss to continue. The plant may be underperforming, but normal changes in irradiance, temperature and availability can make it difficult to see how much of that loss is actually caused by dust.
A useful study by Merissa Coello and Liza Boyle examined whether commonly available information—airborne particle concentrations, rainfall and panel angle—could be used to estimate how soiling changes over time. The answer was encouraging, but also came with an important warning: a model can guide the investigation; it should not make the cleaning decision alone.
A simple way to estimate when soiling is building
The study’s idea is easy to understand. Higher concentrations of airborne particles can lead to more material settling on the modules. Tilt affects how much remains on the surface. Rain may remove some of the accumulated material. As the remaining layer becomes heavier, more light is scattered or absorbed and less reaches the solar cells.
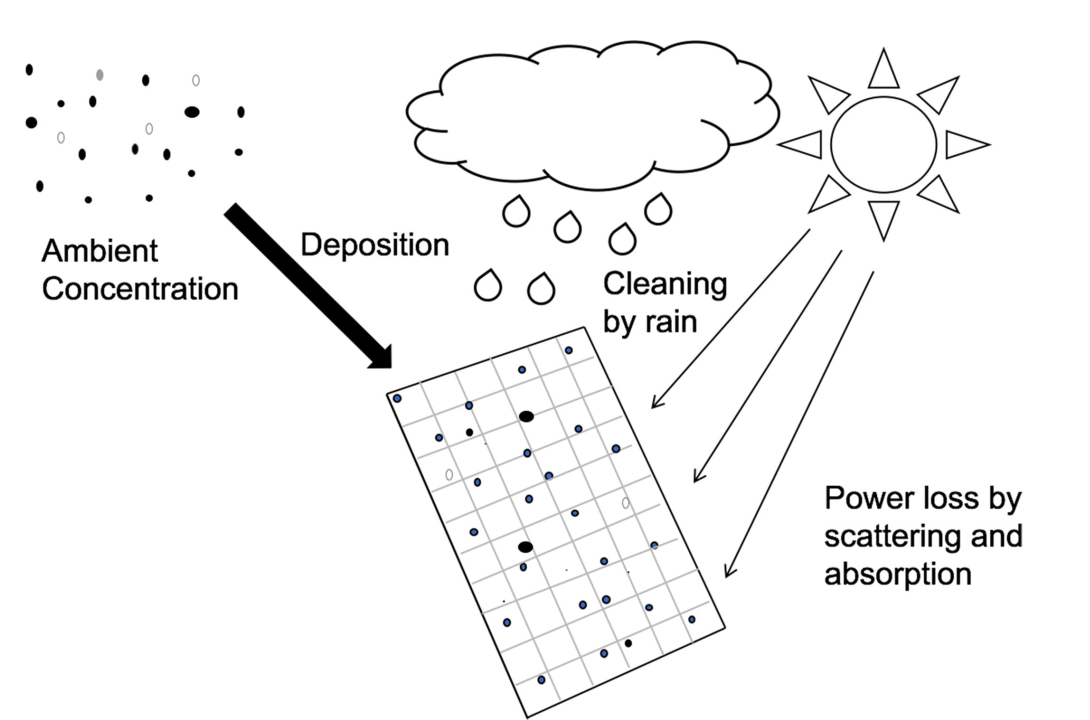
In the research, this approach was compared with measured soiling data from seven PV sites in Arizona and California. When the model used the rainfall that actually occurred, it generally followed the timing and size of measured soiling events better than when it used rainfall from a “typical” weather year.
Why this matters to an operator
Monthly rainfall averages can hide the event that matters. Two months may receive the same total rainfall, but several light showers and one strong downpour may leave the modules in very different conditions. The timing and cleaning effectiveness of each event are more useful than the monthly total alone.
Does rain mean the panels are clean?
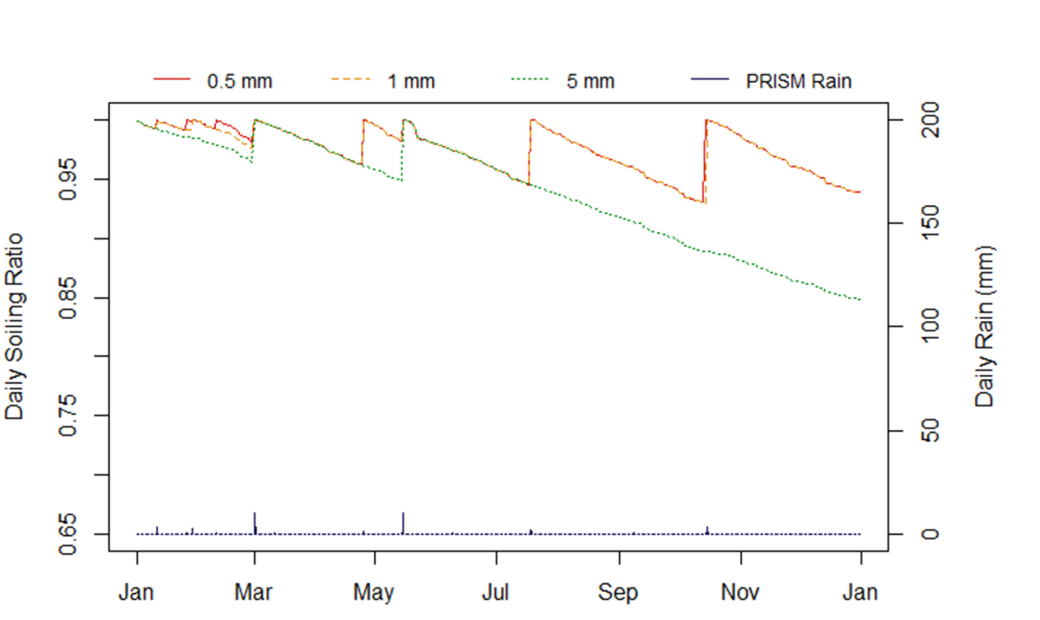
Not necessarily. The research model assumed that rainfall above 1 mm completely cleaned the array. That was a modelling choice—not a rule that every solar farm can safely adopt.
The researchers tested what happened when the assumed cleaning threshold changed. The result below shows why this matters. When the model required a larger 5 mm rain event before treating the modules as clean, it predicted much more accumulated loss than when it used thresholds of 0.5 mm or 1 mm.
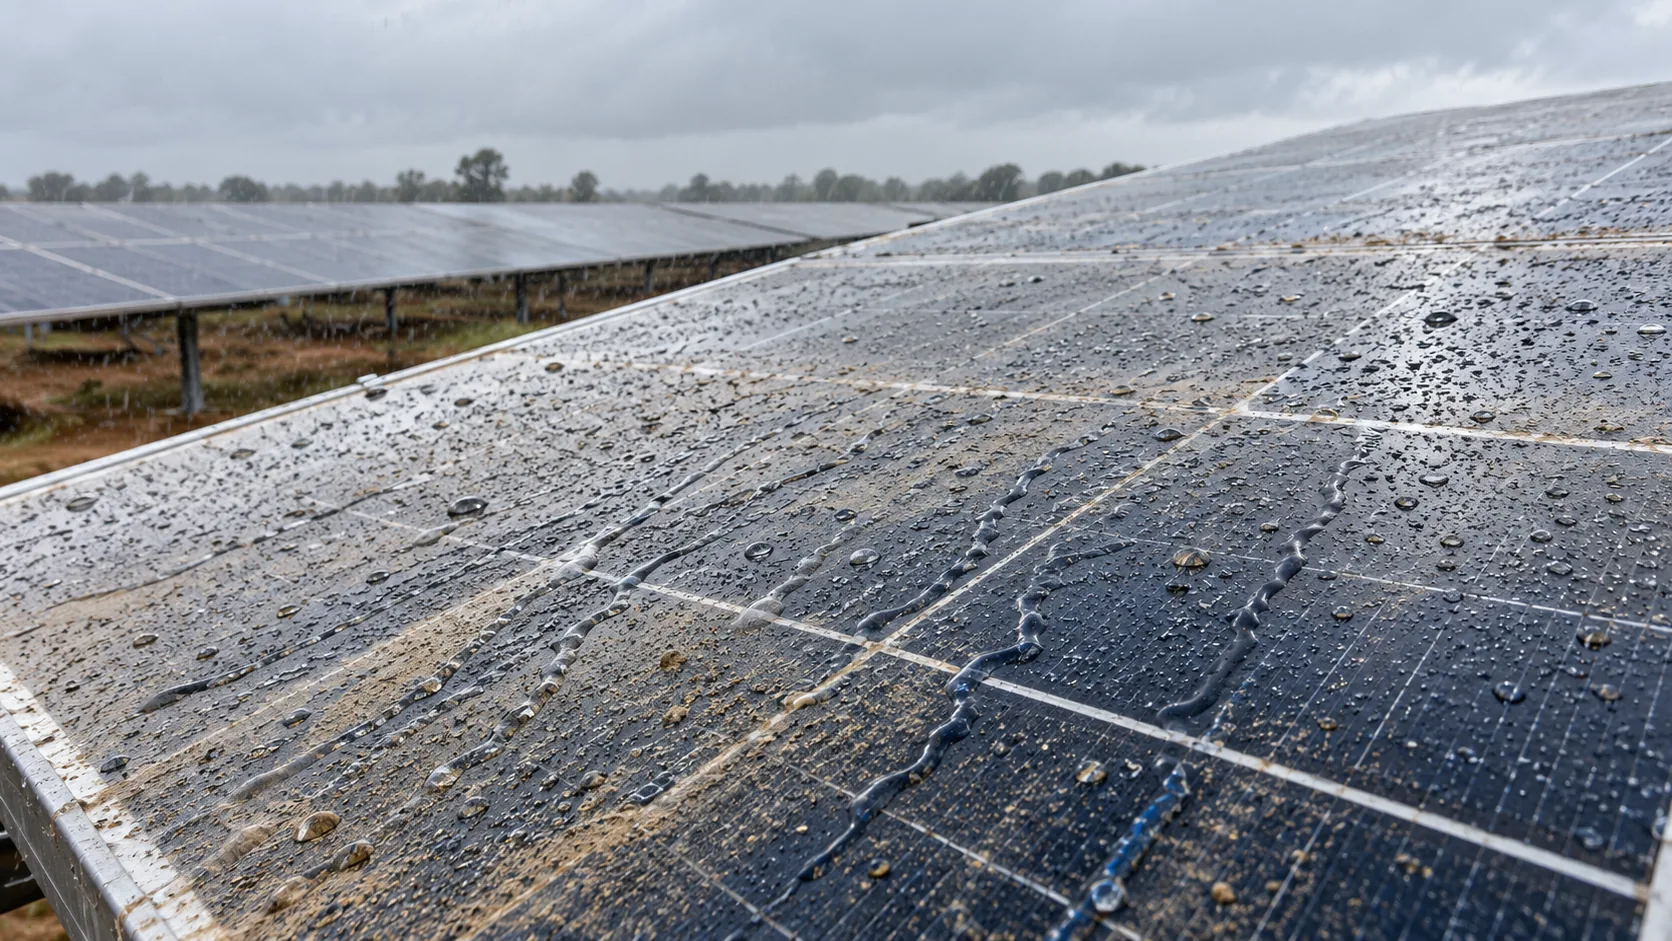
At a real plant, cleaning by rain depends on more than millimetres. Rain intensity and duration, dust chemistry, module tilt, wind, uneven wetting and the time since the last effective clean can all influence recovery. Fine dust may move and dry as residue. In other cases, dew and repeated wetting can help material adhere more strongly.
The safest interpretation is therefore: rain is evidence to check, not proof that the soiling loss has disappeared.
Can public data tell you whether to clean?
Public PM10, PM2.5 and rainfall data can provide a useful first screen, particularly for a site without a dedicated soiling station. They can help identify periods when dust is likely to be accumulating and explain why the loss may change after weather events.
But the nearest air-quality monitor may be far from the plant, and local sources such as unsealed roads, harvesting, construction or neighbouring land use may dominate site conditions. Public data should therefore be combined with evidence from the plant—not treated as a precise measurement of the module surface.
A better cleaning decision uses four checks
1. Is the loss real?
Compare normalised plant performance, inverter behaviour and availability. Separate likely soiling from faults, clipping, curtailment and sensor problems.
2. Is soiling the likely cause?
Review rainfall, local dust events, module condition and any soiling or reference-sensor data. Look for gradual loss followed by recovery after rain or cleaning.
3. What can the clean recover?
Estimate the energy that could be recovered over the period before the next likely rain or clean—not just the loss on one day.
4. Is recovery worth the cost?
Compare the value of recovered generation with labour, water, equipment, access, safety and operational impacts.
This approach replaces “Is it dusty?” with a more useful question: “Is the recoverable loss now large enough to justify action?”
What this research does—and does not—prove
Useful evidence, not a universal cleaning rule
- The model showed that relatively simple environmental data can reproduce the broad pattern of soiling over time.
- Actual rainfall timing was especially important to the result.
- Coarser particles within the PM10 range had more influence than fine PM2.5 particles in the study’s sensitivity analysis.
- The comparison covered seven sites in the south-western United States, not Australian solar farms.
- The model did not represent every mechanism, including wind-driven resuspension, dew-related adhesion, module surface differences and particles larger than PM10.
For an Australian plant, the model is best used as a transparent starting point. Its assumptions should be checked against local weather, dust sources, module configuration and observed performance. A controlled clean on a representative area, or comparison with a clean reference device, can reveal whether the estimated loss is credible before a site-wide cleaning decision is made.
Frequently asked questions
Does rain clean solar panels?
It can reduce soiling, but it does not guarantee a complete clean. Check the plant response after the event rather than assuming that any recorded rainfall reset the loss.
Can public weather and air-quality data identify soiling?
They can support an initial estimate of when soiling may be building. Plant data or field measurements are still needed to confirm the cause and magnitude.
Should a solar farm use a fixed cleaning schedule?
A fixed schedule is simple, but it may clean too early or too late. A loss- and cost-based trigger is more responsive to actual site conditions.
Was this model validated in Australia?
No. The published study used sites in Arizona and California. Australian projects require local validation before using the model for operating decisions.
Source and figure licence
Coello, M. and Boyle, L. (2019), “Simple Model for Predicting Time Series Soiling of Photovoltaic Panels”, IEEE Journal of Photovoltaics, 9(5), 1382–1387. View the paper via DOI.
The source article is licensed under the Creative Commons Attribution 4.0 International licence. Figures were cropped from the published pages for web presentation; the underlying diagrams and data were not modified. The authors and IEEE do not endorse SolarOZ or this interpretation.
Related SolarOZ content
Turn soiling evidence into a practical decision
SolarOZ helps commercial and utility-scale PV operators assess whether soiling is materially affecting output, interpret weather and performance evidence, and compare the value of recovered energy with the real cost of cleaning.
Explore soiling management Discuss your site